 |
 |
 |
|
|
|
|
| Contact: | Robert H. Morris | PO Box 2008, MS 6085 | |
|---|---|---|---|
| Program Manager | Oak Ridge, TN 37830 | ||
| Modeling and Simulation Group | tel: (865) 576-5878 | ||
| Computational Sciences and Engineering Division | fax: (865) 576-0003 | ||
| Computing and Computational Sciences Directorate | email: visac@ornl.gov | ||
| Oak Ridge National Laboratory | web: visac.ornl.gov |
VISAC, the Visual Interactive Site Analysis Code, allows the mission planner to predict and analyze the outcomes of different types of attacks designed to defeat the operation of large facilities. This easy-to-use tool allows the user to choose a facility, apply the attacks and then calculate an event tree/fault tree system to evaluate what would happen to that facility. VISAC includes several examples of nuclear facilities: many nuclear power plants, two fuel reprocessing plants and a plutonium production reactor.
VISAC works by combining different types of computer models for the same plant. For every facility, a logic model describing the relationship between plant components and overall facility operation is needed. For certain types of attacks, a geometry model describing the physical layout of the plant is needed. For chemical releases, some facilities contain an inventory list and a room-connectivity model in order to run the MBLM code. All of these models can be edited as much or as little as the user desires. For simple attacks against predefined facilities, the user is not required to modify the models at all.
Reports in the popular news media have indicated that nuclear power plants are prime targets for terrorist organizations. A likely avenue for such an attack is a bomb carried by car or truck, similar to the recent events listed in Table I. Car bombs require less preparation, skill, or manpower than complex attacks such as those of September 11, 2001.
The managements of nuclear power plants, as well as other infrastructure targets, need to know the parts of their facilities where a bomb explosion could lead to facility shutdown -- or in the worst case, core damage (potential of release of hazardous materials). These areas need to be identified so that they can be adequately protected.
| Date | Target/Location | Delivery/Material | TNT equiv (lbs) | Reference |
|---|---|---|---|---|
| Apr 1983 | US Embassy Beirut, Lebanon |
van | 2000 | www.beirut-memorial.org |
| Oct 1983 | US Marine Barracks Beirut, Lebanon |
truck, TNT with gas enhancement | 12000 | www.usmc.mil |
| Feb 1993 | World Trade Center New York, USA |
van, urea nitrate and hydrogen gas | 2000 | www.interpol.int |
| Apr 1995 | Murrah Federal Bldg Oklahoma City, USA |
truck, ammonium nitrate fuel oil | 5000 | US Senate documents |
| Jun 1996 | Khobar Towers Dhahran, Saudi Arabia |
tanker truck, plastic explosive | 20000 | www.fbi.gov |
| Aug 1998 | US Embassy Nairobi, Kenya |
truck, TNT, possibly Semtex | 1000 | news reports, US Senate documents |
| Aug 1998 | US Embassy Dar es Salaam, Tanzania |
truck | 1000 | US Senate documents |
| Oct 2000 | Destroyer USS Cole Aden Harbor, Yemen |
small watercraft, possibly C-4 | 440 | www.al-bab.com news.bbc.co.uk |
To determine the areas where nuclear facilities are vulnerable, a calculational tool is needed that can quickly evaluate the effects of a bomb explosion in or around the buildings of a facility and determine the probable impact on facility operation as well as the probability of an accompanying radiological release. The Visual Interactive Site Analysis Code (VISAC) developed at Oak Ridge National Laboratory (ORNL) does this using a geometric model of the facility coupled to an event/fault tree model of plant systems to analyze the effects of blasts. The event/fault tree models associated with facility vulnerability calculations often involve unreliable systems (systems with high component failure probabilities resulting from an attack scenario). For VISAC to analyze such situations accurately, ORNL had to develop some novel techniques for evaluating event/fault trees associated with unreliable systems.
 |
Murrah Federal Building |  |
Murrah Federal Building |
 |
Khobar Towers |  |
Destroyer USS Cole |
VISAC has many capabilities and is used in three different ways.
Running projects is the real emphasis behind VISAC - to find out what will happen to a facility when subjected to various types of incidents. A VISAC project consists of a series of incidents (attacks) against a given facility. Incidents can be combined in any order or can happen at the same time. Each of these incidents is just a different way of damaging the critical components of the logic model. The five types of incidents are:
 Quick Blast - user selects a location inside or outside the plant,
then chooses a charge size and type. For basic models, buildings are
damaged. For detailed models, critical components are given fractional
damage probabilities. Three types of blast models are available.
Quick Blast - user selects a location inside or outside the plant,
then chooses a charge size and type. For basic models, buildings are
damaged. For detailed models, critical components are given fractional
damage probabilities. Three types of blast models are available.
 Component Damage - individual components are specified and assigned
failure probabilities directly by the user. For basic models, individual
buildings are assigned these damage probabilities.
Component Damage - individual components are specified and assigned
failure probabilities directly by the user. For basic models, individual
buildings are assigned these damage probabilities.
 Region Damage - facility components within a given area of the
plant are completely damaged. User selects the building, the floor of
the building, and the size of the region through a graphical user
interface.
Region Damage - facility components within a given area of the
plant are completely damaged. User selects the building, the floor of
the building, and the size of the region through a graphical user
interface.
 Quick Blast from Grids - damages components using pre-run Quick
Blast calculations. Thousands of such Quick Blast runs are supplied with
VISAC for each library plant. User can select an attack based on his
desired results. The user can even add to the list of pre-calculated
grid points for future use.
Quick Blast from Grids - damages components using pre-run Quick
Blast calculations. Thousands of such Quick Blast runs are supplied with
VISAC for each library plant. User can select an attack based on his
desired results. The user can even add to the list of pre-calculated
grid points for future use.
 Accident - a typical accident that the plant could experience
(fails upper level gates in the logic model). User selects an accident
from a list of defined accidents.
Accident - a typical accident that the plant could experience
(fails upper level gates in the logic model). User selects an accident
from a list of defined accidents.
VISAC calculates the fault trees and event trees for each incident using the cumulative damage to the components. The analysis that VISAC reports consists of one or more aspects - things such as core damage to a reactor, facility kill, material release from the plant, etc. Each of these aspects is described in terms of the consequences listed for the event trees. VISAC is very general, so that users can add fault trees and event trees to model any desired aspect of the plant.
VISAC, a Java code, uses several other Java packages to carry out facility defeat analysis. Each of these packages has its own documentation, attached to this document. These packages include:
|
The main window of VISAC is divided into two panels: one panel on the left consisting of an expandable tree structure describing the current facility or project. The tree shows the incident details of the project or the model details of the facility. The user can expand or condense the tree to show more or less information. The user may also double-click items in the description to launch the appropriate editor/viewer for that information. The second panel on the right shows a diagram or image of the current facility. Messages will appear in the left panel to help the user start the analysis procedure. |

Figure 1. The main VISAC window. |
The menu structure of VISAC is laid out left-to-right in the order in which the user will typically use things:
The user can load a facility by using the menu option Facility/Load an Existing Facility. A list box of all the available facilities (including any created by the user) will appear. Simply choose a facility from the list and click on "Continue".
The facilities included in the VISAC library that have been modeled at a detailed level are:
When a facility is loaded, an expandable tree structure will be displayed in the left panel of the VISAC window. This will show which models have been defined for this facility and any other information, such as facility descriptions or animations exist.
With the September 2002 update to Windows XP (known as Service Pack 1), Microsoft suspended distribution of the Indeo codecs as a base part of its operating system. In order to meet the needs of those who use Windows XP and require Indeo codecs, Ligos created a special version of Indeo Video 5 called Indeo XP for Windows (also know as Indeo Video version 5.2).
Although Indeo XP was previously only available for Windows XP, it has now been made available for all Windows OSes from Windows 95 to Windows XP, and is the only version available through Ligos.
"Indeo XP for Windows" can be purchased from Ligos through their electronic store for $14.95. http://www.ligos.com/estore.htm
If the texturized movies do not work on your Windows XP SP1 system, you may wish to purchase the above program.
VISAC uses several types of models to make it calculations. The logic model describes how the different aspects of facility operation are related back to the individual critical components. The geometry model describes the entire plant geometry in terms of solid shapes, such as cylinders and rectangular parallelpipeds. The MBLM model contains inventories of haxardous materials for each critical component.
All of the models used by VISAC can be displayedby the user.
The logic models tell VISAC how to propogate damage from the basic events, through the plant safety systems to a final consequence for each aspect of the plant. This is done using five model parts:
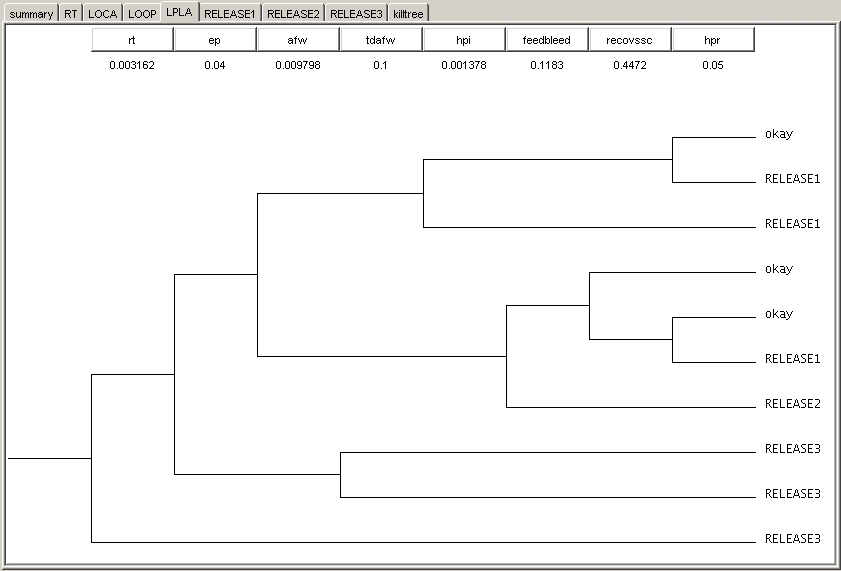
Figure 2. An event tree from the west560 plant logic model. |
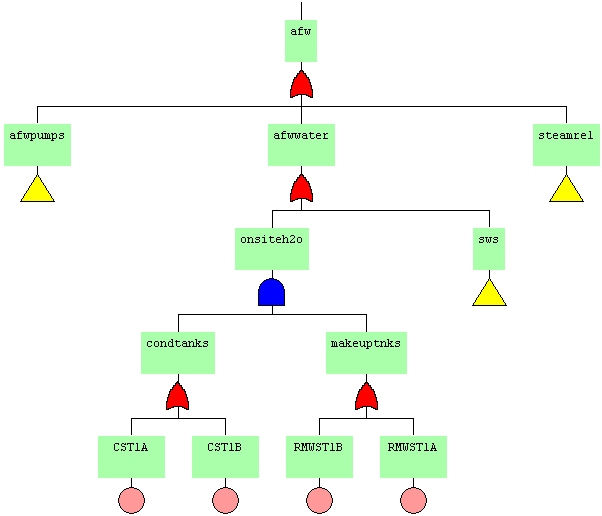
Figure 3. A fault tree from the west560 plant logic model. |
|
The most important of these the fault tree/event tree model. Using EFTed in its View mode, users can see how the individual basic events (which correspond to the geometric critical components) are connected using "and" and "or" gates to form fault trees for plant subsystems. These fault trees are then connected together using an event tree. Paths through an event tree are determined by which fault trees have been failed due to basic event damage. Each sequence in an event tree ends with with either another event tree or a consequence. The other parts of the logic model each have their own viewer accessable from VISAC by either the menu bar or the expandable tree structure on the left hand side of the VISAC window. The analysis parameters group several event trees together to describe an aspect. The calculation parameters tell EFcalc how do perform the calculations. Gate downtimes are used to supercede downtimes calculated by EFcalc for certain gates where the system downtime is known. Accident definitions list which systems are failed for each of the defined accidents. The logic models are stored as a set of ASCII text files. |
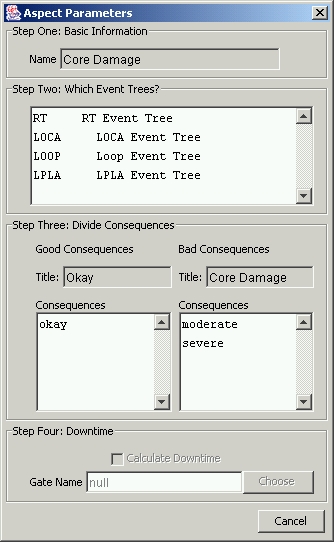
Figure 4. Setting up an aspect. |
|
VISAC's main interface for the geometry model is the Edificio editor. When using Edificio to view the facility geometry, each floor of each building can be displayed along with information about all of the critical components on that floor. Minimum and maximum blast overpressure fragilities are also listed for each critical component. The blast overpressure fragility values can also be viewed directly from VISAC through either the menu bar or the expandable tree structure. This separate viewer allows users to see all of the fragility information for all the components at once. The way these fragilities are used by the QuickBlast package is as follows: for overpressures less than the minimum, no damage to the component occurs. For overpressures greater than the maximum, the critical component is considered failed with a probability of 100%. For overpressures in between, the failure probability is a linear function with overpressure. The last part of the geometry model that the user can view is the link between the geometry critcal components and logical basic events. Any number of critical components can be mapped to a basic event. A given critical component can be mapped to exactly one basic event. This link is how damage calculated by QuickBlast using the geoemtry model is transfered to the logic model to evaluate the event/fault trees. |
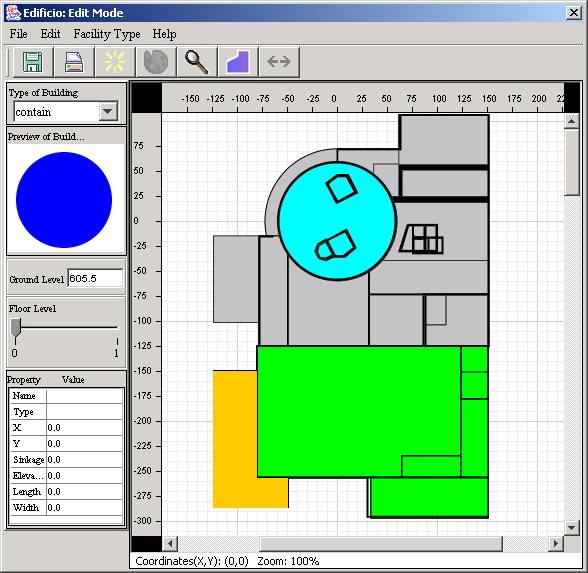
Figure 5. Edificio, the geometry editor, shown with a portion of the west560 plant. |
The geometry model is stored as a set of ASCII text files, one per building, in a specific format. These files are then referenced by another ASCII text file (the *.bil file) to place the buildings onto a common canvas.
The base MBLM model descibes the different rooms and how they are connected together. This information is displayed using MblmGui. The plant inventory is a list materials that each basic event contains, and which room it is located. This information is used to build an input deck for the MBLM code, which can calculate material transport inside buildings. The MBLM model is not used for all types of facilities, only for those facilities where releases are a concern.
The MBLM model is stored as a set of two ASCII text files, one for the base MBLM connectivity model and one for the inventory.
The files used by VISAC are based on the BRL-CAD system. BRL-CAD uses several formats, one of which is a text file that consists of instructions that the user would ordinarily type at the user command prompt. The following table lists the subset of BRL-CAD commands that VISAC and its viewers use:
| Command | Use |
|---|---|
| title | title Description follows |
| units | units feet |
| in | in solidname type param_1 ... param_n |
| regdef | regdef id air los material |
| r | r regionname operator_1 solidname_1 ... operator_n solidname_n |
| g | g regionname_1 ... regionname_n |
The following solid types can be used by VISAC: rpp, arb8, trc, ellg, rcc, sph. The material codes that VISAC uses are 100-air, 500-concrete, 900-critical component. Comments can be inserted into the file using "/*" at the beginning and "*/" at the end of each comment line.
In addition to the above BRL-CAD commands, the geometry files that VISAC uses
can also contain VISAC-specific information. Each geometry file should represent
a single building. The extra information to describe the building is listed in the
file using the "visac" command:
| Keyword | Use |
|---|---|
| name | name buildingname |
| description | description description follows |
| ground | ground groundlevel |
| sinkage | sinkage sinkagevalue |
| angle | angle rotationangle |
| floors | floors lower_1 upper_1 ... lower_n upper_n |
| total | total operator_1 solidname_1 ... operator_n solidname_n |
| toptotal | toptotal operator_1 solidname_1 ... operator_n solidname_n |
| soil | soil solidname_1 ... solidname_n |
The name should be a short string and the same as the highest level group defined for the building. The total and toptotal are defined just like BRL-CAD regions. The soil command lists all of the soil cut-out regions. Floor values include two values per floor - the lower and upper. Use of the "*" in group definitions should be used carefully and should follow at least one character. ("power*.r*" is okay, "*.r1" is not.)
units feet
visac name    p01int
visac ground  12.3
visac sinkage 40.3
visac floors  -24.0 12.8
visac description Intake Building
/* p01int.txt  Intake Building            Date: January 16, 2002 */
/* consists of the intake building and a small pit next to the building */
/* origin:   0.00 196.00 -28.00  (4' walls, floor, and roof) */
in p01int1f.s1  rpp   0.00  60.00 196.00 320.00 -28.00 -24.00
in p01int1r.s1  rpp   0.00  60.00 196.00 320.00  12.80  15.80
in p01int1w.s1  rpp   0.00  60.00 196.00 200.00 -24.00  12.80
in p01int1w.s2  rpp   0.00  60.00 316.00 320.00 -24.00  12.80
in p01int1w.s3  rpp  56.00  60.00 200.00 316.00 -24.00  12.80
in p01int1w.s4  rpp   0.00   4.00 200.00 316.00 -24.00  12.80
/* origin:  60.00 249.00 6.  (2' walls and floor, no roof)*/
in p01int2f.s1  rpp  60.00  78.00 249.00 275.30  4.     6.
in p01int2w.s1  rpp  60.00  78.00 249.00 251.00  6.  15.80
in p01int2w.s2  rpp  60.00  78.00 273.30 275.30  6.  15.80
in p01int2w.s3  rpp  76.00  78.00 251.00 273.30  6.  15.80
/* total solids */
in totalint01.s1 rpp   0.00  60.00 196.00 320.00 -28.00 15.80
in totalint01.s2 rpp  60.00  78.00 249.00 275.30   6.00 15.80
in toptotal.s1   rpp   0.00  60.00 196.00 320.00 0. 1.
in toptotal.s2   rpp  60.00  78.00 249.00 275.30 0. 1.
in sinkint01.s1  rpp   0.00  60.00 196.00 320.00 -28.00 15.80
in sinkint01.s2  rpp  60.00  78.00 249.00 275.30   4.00 15.80
visac total     u totalint01.s1 u totalint01.s2
visac toptotal  u toptotal.s1 u toptotal.s2
visac soil      sinkint01.s1 sinkint01.s2
regdef 1001 0 100 500
r p01int1f.r1  u p01int1f.s1
r p01int1r.r1  u p01int1r.s1
r p01int1w.r1  u p01int1w.s1
r p01int1w.r2  u p01int1w.s2
r p01int1w.r3  u p01int1w.s3
r p01int1w.r4  u p01int1w.s4
r p01int2f.r1  u p01int2f.s1
r p01int2w.r1  u p01int2w.s1
r p01int2w.r2  u p01int2w.s2
r p01int2w.r3  u p01int2w.s3
g p01int1 p01int1f.r1  p01int1r.r1  p01int1w.r*
g p01int2 p01int2f.r1  p01int2w.r*
g p01int p01int1  p01int2
 Edificio Geometry Editor
Edificio is the VISAC geometry editor. It is designed for use with BRL-CAD models of buildings and facilities. It has several modes for differing tasks, such as editing the geometry or components of buildings or selecting blast points and regions for VISAC incidents.
This page is intended to give just the basics of Edificio for use in running VISAC projects. For a full description of Edificio and its vast editing capabilities, see the VISAC Help page, Edifico Help Table of Contents. The focus here will be Edificio's Cross-Hair mode and Blast Region mode.
The window consists of the viewing canvas, several tools on the left hand side, and several buttons just below the menus. Most of the tools and buttons concern the editing capabilities and will not be discussed here.
|
In the canvas, the facility is shown from an overhead view. Each building is shown with a different color and all of the walls from each floor are visible. One of the boxes on the left-hand side of the Edificio window is the 'Navigator'. This shows where the current view is in relationship to the full extent of the facility. Users can change which portion of the facility is shown on the canvas by moving the scrollbars of the canvas or by grabbing and moving the black rectangle in the 'Navigator' box. Also on the left-hand side of the window is information listing the groundlevel elevation of the facility. One floor of a particular building can be shown by first selecting the building (by clicking on it) and then adjusting the 'Floor Level' slider bar. Note that the lower portion of the left-hand side of the window now displays some information for the selected building. |

|
When a floor of building is showing, a new window pops up listing all of the critical components contained on that floor. The two windows work together - selecting a component in one window will highlight the component in the other. This is useful in identifying components. To look at another building, first either set the 'Floor Level' slider of the current building back to floor '0' or close the critical component window. Then select another building by clicking on it. The critical component window also shows a red bar, representing how much vertical space a component takes up relative to the distance between the floor and the ceiling.
Zooming can be done by first clicking on the zoom tool,
 . The cursor will change into
a magnifying glass. Place the cursor where you wish to zoom and then click
the left mouse button to zoom in or the right mouse button to zoom out.
When done zooming, reset the cursor to the arrow by clicking on the
arrow tool icon
. The cursor will change into
a magnifying glass. Place the cursor where you wish to zoom and then click
the left mouse button to zoom in or the right mouse button to zoom out.
When done zooming, reset the cursor to the arrow by clicking on the
arrow tool icon  .
.
The walls of each building can be toggled on/off with the tools
 and
and
 when no building is selected
or the selected building is at floor 0.
when no building is selected
or the selected building is at floor 0.
While navigating, the tools
 and
and
 can be used to
show the center of the facility and resize the drawing area.
These are useful, for example, if you zoom in too far and get lost.
can be used to
show the center of the facility and resize the drawing area.
These are useful, for example, if you zoom in too far and get lost.
These features are also available through the options of the 'Edit' menu.
Selecting a Region - Blast Region ModeEdificio can be used to select a circular region of one floor of one building for a VISAC Region Damage incident. First select the building by clicking on it. Next, select the floor using the 'Floor Level' slider.
Now select the 'Set a Blast' icon
|

|
Selecting a Blast Point - Cross-Hair Mode
Edificio can be used to pick a blast point for a QuickBlast incident.
A location can be picked
outside of any building or on a floor of a building. For an interior point,
first select the building by clicking on it. Next, select
the floor using the 'Floor Level' slider. For interior or exterior points,
now select the crosshair tool A small dialog box will appear to set the elevation of the blast (feet above sea level). Set the elevation and select 'Commit' to send this point back to QuickBlast or select 'Cancel' to select another blast location. |

|
In addition to the geometry editor Edificio, VISAC has a set of viewers to provide detailed views in both 2D and 3D. These are used for viewing the facility geometry models as well as viewing the damage results from incidents.
| Name | Description | |
|---|---|---|
 |
2D Triple View Slicer | Shows three section views, like a standard engineering drawing. |
 |
QuickView 3D | Interactive scengraph viewer. Approximates curved surfaces with sets of planes. |
 |
3D Ray Tracer | Precision renderer for presentation-quality graphics. |
 |
Topographic Viewer | Used for terrain contour maps and elevation shading maps. |
These viewers all have similar menu structures and display VISAC models using a standard color scheme:
| BRL Code | Color | Material |
|---|---|---|
| 100-199 | pink | air |
| 200-299 | green | soil |
| 500-599 | gray | concrete |
| 600-699 | yellow | rebar steel |
| 700-799 | light gray | rock rubble |
| 800-899 | blue | steel plate |
| 900-999 | red | critical components |
| 911 | cyan | broken critical components |
| 111 | dark gray | holes generated by QuickBlast |
| --- | very light gray | interiors of basic models |
In these viewers, the colors for each material type present can also be selected by the user by using the 'Geometry' menu, 'Materials/Colors' option.
The 'File' menu in any of the viewers allows the geometry to be exported or the current image to be saved.
2D Triple View SlicerThis presents views of the plant along three cuts planes, one in each dimension, giving a section drawing similar to a standard engineering drawing. Each section view shows the geometry of the facility in that plane - top, front and side. Navigation is done with the mouse or using the menu options. This geometry viewer is also used to set blast points, regions of damage and set individual component failure probabilities for the different VISAC incidents.
|
The blue lines in each view show the position of the cut planes for the section planes shown in the other views. To move the cut planes, use the slider bars in the lower left panel, type the values directly into the boxes in the lower left panel or click somewhere while holding the Shift key. Once the cut planes have been repositioned, use the 'Redraw' button to recalculate the views. To zoom, in any view press the mouse button at one corner of your desired zoom area, drag to the opposite corner, then release. This will change the images in the view you selected and the other views sharing those coordinate axes. Zooms can also be done by adjusting the bounding box minimums and maximums in the center left panel. Type in the values and then use the Redraw button. Zooming can also be done using the options under the 'Scene' menu, option 'Camera', option 'Zoom In' or 'Zoom Out'. The full extent of the plant can be shown using the 'Scene' menu, option 'Camera', option 'Default View'. |

Figure 6. A portion of the west560 plant shown with the Triple View Slicer |
When the mouse is positioned in one of the three views, the status bar below the images shows the coordinates (usually feet), the name of the region, and the material code for the region. For detailed models, the names of critical components and their damage probabilities will also be displayed. For basic models, the building name will be displayed.
Colors for each material type present can also be selected by the user by using the 'Geometry' menu, 'Materials/Colors' option. Rendering of materials can be either as solid color areas (menu 'Scene', option 'Render Style', option 'Filled') or as colored outlines (menu 'Scene', option 'Render Style', option 'Edges'). The background color, used for undefined areas, can be set by using 'Scene' menu, 'Background Color' option. The default background color is white.
The 'File' menu allows the geometry to be exported or the current image to be saved.
Selecting a RegionWhen used to select a rectangular volume for a Region Damage incident or for the bounds of a QuickBlast Grid, the volume selected will be the volume enclosed by the bounding box values. The bounding box can be adjusted by typing the values directly into the 'Bounding Box' area (with the z values being feet above sea level) or by using the zoom features (click and hold left mouse button, drag across screen, release). To be sure which values will be used for the volume, use the 'Redraw' button. Once the desired volume has been selected, use the menu 'File', option 'COMMIT' to send that region back to the incident editor. Selecting a Blast PointWhen used to pick a blast point for a QuickBlast incident, the point returned will be the coordinates of the cut planes, whether or not the images have been redrawn. Adjust the cut planes in any of the ways described above so that the location of the blast is shown in the 'Cut Planes' box. To be sure of the point's values, use the 'Redraw' button. The selected point will be at the intersection of the blue lines in each view. Another way to move the cut planes is to click on the appropriate slider bar, and then use the arrow keys to move in increments of 1 foot. Once the desired point has been selected, use the menu 'File', option 'COMMIT' to send that point back to the incident editor. Setting Component DamageWhen used to set critical component failure probabilities for a Component Damage incident, simply click on a critical component to bring up a window to set that component's failure probability. Damaged components will appear in a different color. When done, simply close the viewer ('File', 'Close') and the updated component damage will be returned to the incident. |
 
|
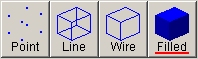
QuickView 3DThis program generates a 3D view of the plant geometry by converting all of the solids into groups of triangles. While very fast, some features of the geometry are not preserved, such as curved surfaces or very small details. This geometry viewer can also used to set individual component failure probabilities for VISAC Component Damage incidents.
|
Rendering can be done in four different ways: show the points of each triangle, show the lines of every triangle, show the lines of every triangle facing the camera (wireframe) or shade each triangle facing the camera. These rendering modes can be activated using either the 'Scene' menu, 'Render Style' option or by using the icons in the tool bar. |
|
NavigationNavigation is done by either through the 'Scene' menu, 'Camera' option or by using the mouse. Menu commands include camera position (moves camera up, down, right, left, forward or backward), camera orientation (twists camera up, down, right or left), and camera revolution, which rotates the camera around the model (up, down, right or left). The default view can be obtained using the menu 'Scene', option 'Camera', option 'Default View'. Clicking on any point of the geometry will center that point within the view screen. For navigation with the mouse, first the mouse mode must be chosen using one of the icons on the tool bar. There are four mouse modes: Move, Turn, Pivot and Select. In Move mode, clicking and holding the mouse will move the position of the camera. Similarly, in Turn or Pivot mode, clicking and holding the mouse will turn the direction of the camera or pivot the camera about a fixed point. Select Mode allow the user to define a rectangle (click, drag, release) to zoom to. Using the mouse wheel will move the camera position forwards and backwards, independent of which mouse mode is active. |
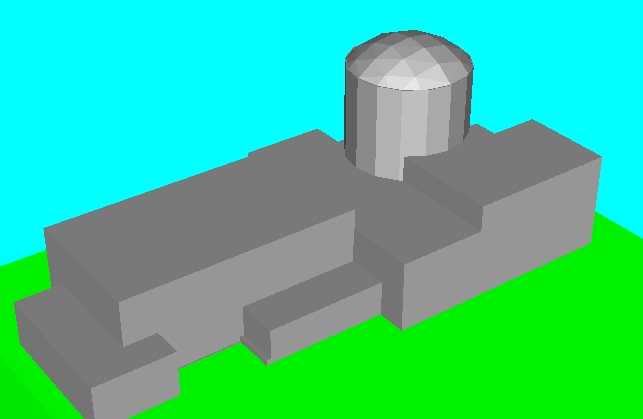
Figure 7. A generic plant shown with QuickView 3D.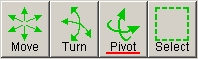
|
As the mouse is moved around the image, the status bar below the image shows the coordinates (usually feet), the name of the region, and the material code for the region. For detailed models, the names of critical components and their damage probabilities will also be displayed. For basic models, the building name will be displayed.
The geometries for the VISAC library plants have collections of related regions called groups. These groups can be selected or de-selected for display by using the 'Geometry' menu, 'Choose Groups' option.
Colors for each material type present can also be selected by the user by using the 'Geometry' menu, 'Materials/Colors' option. Another way to help visualize the interior of facilities is to make some of the materials transparent. Associated with each material is an alpha value. An alpha of 255 makes a material completely opaque and an alpha of 0 makes a material completely transparent. An alpha value in between will give different levels of transparency. The background color, which defaults to cyan, can also be changed by the user.
The 'File' menu allows the geometry to be exported or the current image to be saved.
|
Simple animation is available by either the menu 'Animate', 'Spin' option or by using the spin icon in the tool bar. To stop spinning, use the menu 'Animate', option 'Stop' or the stop icon in the tool bar. For systems with three monitors attached as a single desktop, a three-screen view can be launched with the "triple screen" icon. This makes for a miniature CAVE-like environment. Parameters for screen sizes and viewing distance are set using the 'Scene' menu, 'Advanced Options' choice. The 3D Ray Tracer package can be launched from QuickView using the current camera angle by using the menu 'File', 'Launch Ray Tracer' option. Once a good view of the plant is shown, the Ray Tracer can be used to make presentation-quality images. Menu 'Scene', option 'Cut Planes' allows the user to set upper and lower limits to the render. This can be used to cut the top or bottom off of a facility to view internal structures. |
|
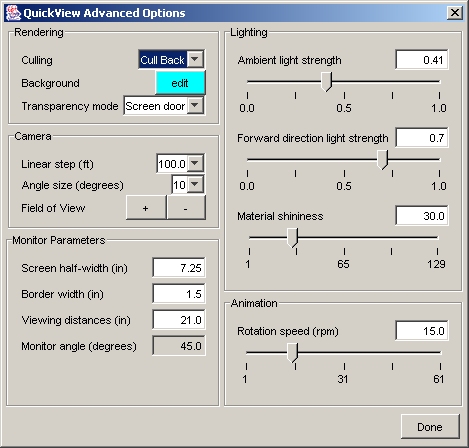
Advanced OptionsThe 'Scene' menu, 'Advanced Options' options allows the users to control some of the finer points of the 3D rendering. These options include the background color (default is white), culling (which triangle faces to hide), the step sizes to take when performing a camera position or orientation change, and the strengths of the ambient and directional lighting, as well as the material shininess, which can be set to enhance the 3D look of the image. The spin rotation rate is also set here, in number of rotations per minute. Changes in these parameters should be seen in the image immediately. |
|
When used to set critical component failure probabilities for a Component Damage incident, simply double click on a critical component to bring up a window to set that component's failure probability. Damaged components will appear in a different color. There are two tricks to help pick components out of buildings:
3D Ray TracerThis program generates a 3D view of the plant geometry by ray tracing. Ray tracing can be slow for complex geometries but produces excellent images at full resolution. This geometry viewer can also used to set individual component failure probabilities for VISAC Component Damage incidents.
The 3D ray tracer allows the user to degrade the resolution to generate faster images. This is done using the radiobuttons above the image. The numbers represent the number of pixels that will be grouped together per ray. For example, resolution 4 uses a 4 by 4 group of screen pixels for one ray. Resolution 1 uses a single pixel, and therefore takes 16 times as long to create a full image as does resolution 4.
|
The user can move the camera around the facility by selecting options from the 'Scene' menu, 'Camera' option. Options include camera position (moves camera up, down, right, left, forward or backward), camera orientation (twists camera up, down, right or left), and camera revolution, which rotates the camera around the model (up, down, right or left). Zooms are made by moving the camera position forward or backward. Zooms can also be done by selecting a rectanglular region (press the mouse button at one corner of your desired zoom area, then drag to the opposite corner, then release). The default view can be restored using the 'Scene' menu, 'Camera' option, 'Default View' option. When using the 3D Ray Tracer to make presentation-quality images, users are encouraged to use QuickView 3D to quickly find a good camera angle, and then launch the 3D Ray Tracer package from that program. Navigating the camera around the Ray Tracer can be very time consuming. |
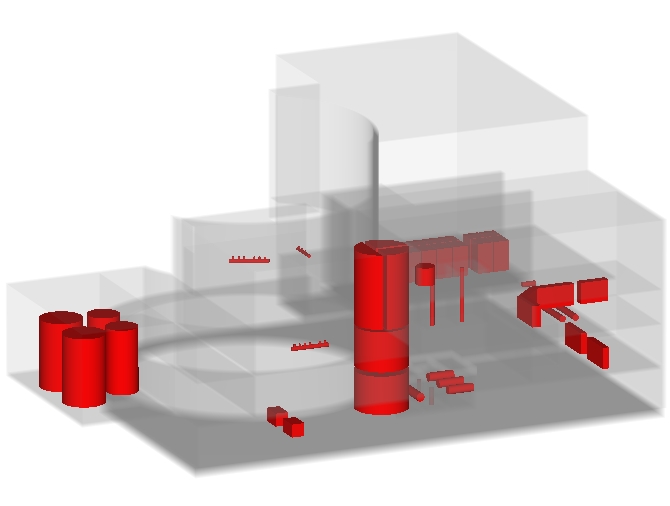 Figure 8. The auxiliary building of the west560 plant. Concrete is shown with an alpha of 13. |
As the mouse is moved around the image, the status bar below the image shows the coordinates (usually feet), the name of the region, and the material code for the region. For detailed models, the names of critical components and their damage probabilities will also be displayed. For basic models, the building name will be displayed.
The geometries for the VISAC library plants have collections of related regions called groups. These groups can be selected or de-selected for display by using the 'Geometry' menu, 'Choose Groups' option.
Colors for each material type present can also be selected by the user by using the 'Geometry' menu, 'Materials/Colors' option. Another way to help visualize the interior of facilities is to make some of the materials transparent. Associated with each material is an alpha value. An alpha of 255 makes a material completely opaque and an alpha of 0 makes a material completely transparent. An alpha between 0 and 255 will make a material partially transparent. For example, with alpha=25, a material will be transparent up to 10 feet (25/255=10). After 10 feet, that material will appear opaque.
The 'File' menu allows the geometry to be exported or the current image to be saved.
To better visualize the internal components, users can set cutter planes to remove sections of the geometry. This is done using 'Scene' menu, 'Cutter Box' option. For each dimension, a cut plane can be defined and the user can select to keep below that plane or above that plane. The user can also specify if he wants to show the geometry for the intersection of the cut planes or the union of the cut planes. Changes will take effect after the 'Redraw' button is pressed.
Render time for an image and the estimated full resolution render time can be found using the 'Help' menu, 'Render Times' option.
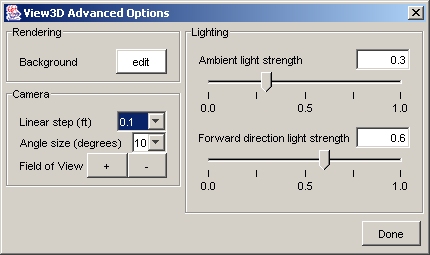
Advanced OptionsThe 'Scene' menu, 'Advanced Options' option allows the users to control some of the finer points of the 3D rendering. These include the background color (default is white), the step sizes to take when performing a camera position or orientation change, and the strengths of the ambient and directional lighting, which can be set to enhance the 3D look of the image. Changes will take effect after the 'Redraw' button is pressed. |
|
When using the 3D Ray Tracer to make presentation-quality images, users are encouraged to use QuickView 3D to quickly find a camera angle, and then launch the 3D Ray Tracer package from that program. Navigating the camera around the Ray Tracer can be very time consuming.
When used to set critical component failure probabilities for a Component Damage incident, simply double click on a critical component to bring up a window to set that component's failure probability. Damaged components will appear in a different color after the next 'Redraw'. There are two tricks to help pick components out of buildings:
Topographic ViewerThis viewer shows the terrain elevations near the facility in the style of a topographic map. For some of the library facilities, elevation data is supplied at a few points near the main buildings. Elevations at other places are calculated by forming triangles between the known points and interpolating.
|
The user can move the camera around the facility by selecting options from the 'Scene' menu, 'Camera' option. The default view can be restored using the 'Scene' menu, 'Camera' option, 'Default View' option. The user can set the extent of the view showing by changing the bounding box parameters, and then pushing the 'Redraw' button. Zooming is done with the mouse (press the mouse button at one corner of your desired zoom area, drag to the opposite corner, then release) or using the 'Scene' menu, the 'Camera' option, and then either 'Zoom In' or 'Zoom Out'. On the right hand side, a scale bar is shown with the minimum and maximum elevations of the facility. Also on the scale bar are the major and minor contour lines and their elevations. |
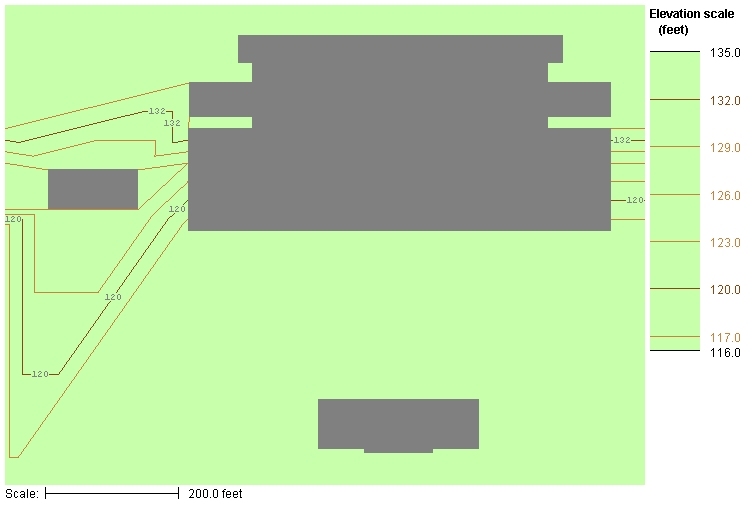 Figure 9. Topographic data shown around a facility. |
As the mouse is moved around the image, the status bar below the image shows the coordinates in feet, with the z dimension being elevation above sea level. If the mouse is pointing at a building, the building name will also be shown in the status bar.
The 'File' menu allows the geometry to be exported or the current image to be saved.
Many different items can be added to the image, in any combination. Each can be turned on or off. Once all of the layers you desire are selected, use the 'Redraw' button to update the image.
Changes will take effect after the 'Redraw' button is pressed.
Since different facilities will have different scales of elevations, the user is allowed to change the intervals for the major and minor contour lines. These can be set using the 'Scene' menu, then 'Advanced Options'. Enter the values for how often you wish contour lines to appear.
Labels are placed randomly on the major contour lines. The number of labels is controled by the label frequency, a value between 0 and 1. A value of zero will not generate any labels. A value of 1 will place a label for each contour in each interopolating triangle. To change the label frequency, use the 'Scene' menu, then 'Advanced Options'.
Each VISAC facility contains four pre-calculated grids of blast points. These and any grids calculated for user facilities can be viewed by either using the Grids/Show Grid Parameters menu option or by clicking on the QuickBlast information in the exapandable tree structure on the left hand side of the main VISAC window.
A grid is simply a set of points that fill a 3D rectanglar volume where the same weapon and blast parameters have been used. These blast points can be displayed as a contour map of outcomes or the grids can be searched to find only the points which match a set of the user's outcome criteria.
VISAC also has two specialty viewers for looking at QuickBlast overpressures and sets of QuickBlast grid data. These viewers have the same look & feel as the geometry viewers from which they are based. Most of the menu options and mouse commands are similar for these viewers.
| Name | Description | |
|---|---|---|
 |
Contour Viewer | Shows QuickBlast grids as contour maps or displays blast points that match the user's outcome criteria. |
 |
Blastwave Viewer | Shows the overpressure (in air) of a QuickBlast calculation. |
Contour ViewerThe contour viewer is the main way to access grid data. A grid is a set of QuickBlast points all calculated with the same weapon and calculational parameters. The locations are evenly spaced in two or three dimensions. Navigation is done with the mouse or using the menu options. This viewer is also used to select one of the QuickBlast points from one of the grids for a VISAC 'QuickBlast from Grids' incident.
|
The viewer contains a single section view of the facility: front, top or side. The bounding box of the view is shown on the left hand side panel, as well as the value of the cut plane that the view is in. For top views, both the absolute height (elevation above sea level) and the relative height (above ground level) are shown. The user can set the extent of the view showing by changing the bounding box parameters, and then pushing the 'Redraw' button. The value of the cut plane can be set by moving the slider bar or typing in the value. Zooming is done with the mouse (press the mouse button at one corner of your desired zoom area, drag to the opposite corner, then release) or using the 'Scene' menu, the 'Camera' option, and then either 'Zoom In' or 'Zoom Out'. |

Figure 10. An example of a grid of large truck bomb QuickBlast calculations for a fictitious nuclear power plant. |
The default view is to show all of the points from all of the grids, and to color-code them by the probability of one of the major consequences determined for the facility. This produces a contour map of the consequence probability. Note that the walls and components are shown in levels of gray so that that they are not mistaken for the color contours representing the consequence level. The data display is controlled by the 'Data Select' tab.
Data can be restricted in several ways: first, the user can select just one or a few of the grids to work with. Second, the user can decide to either
Selecting 'All calculated points by Grid/Aspect' in the 'Display Type' box lets the user pick which aspect to use for all of the selected grids. Select one of the aspects, then which consequence. Return to the image by selecting the 'Contour Plot' tab and then select 'Redraw'.
Selecting 'Selected points based on Outcome' in the 'Display Type' box allows the user to go through each aspect and specify which points to display. For each aspect, the user can pick one consequence and then set upper and lower limits on that consequence's probability. Only those points which fall in between the limits will be shown. When all of the aspects that you wish to be included have been set, return to the image by selecting the 'Contour Plot' tab and then select 'Redraw'.
As the mouse is moved around the image, the status bar below the image shows the coordinates (usually feet), the name of the region, and the material code for the region. For detailed models, the names of critical components and their damage probabilities will also be displayed. For basic models, the building name will be displayed.
The 'File' menu allows the geometry to be exported or the current image to be saved.
The menu 'Scene', option 'Camera', option 'Default View' will set the bounding box and the cut plane to show the center of the volume defined by all of the selected grids.
There are also several menu options under the 'Scene' menu which allow the user to change the view of the plant. These include which view (Top, Front, Side) and what type of render style to use (Filled or Edges). The user can also decide to show or not the blast points with black dots ('Scene', 'Blast Data', 'Blast Points') and decide to use color or black and white contours ('Scene', 'Blast Data', 'Colors').
Also, as the mouse is moved around the facility, a display at the bottom of the viewer reports the coordinates, the geometry region name, the material code, and the building name (or the basic event name if the region is a critical component).
Clicking on a blast point will bring up the BlastWave Viewer which shows a contour plot of the blast overpressure (in air) for that blast point.
To pick a blast point for a VISAC 'QuickBlast from Grids' incident, simply click on one of the displayed blast points. A small dialog will be displayed, asking if you first wish to see the blast overpressure (in air) map using the BlastWave Viewer. If you select 'No' in this dialog or after you close the BlastWave window, a second dialog will ask if this is the point you wish to use in the incident. If it is, select 'Yes'. If not, select 'No' and pick the point you wish to use in the incident.
Work is currently ongoing to create a useful 3D view of the contour data. Several of our test modules are available to be used from the 'File' menu, '3d Viewer' option. All of these tend to be slow and memory intensive, and may result "Out of Memory" errors for large sets of grid data. These should be used with caution as they are still under development.
Blastwave ViewerThis viewer shows a 2D slice of the facility geometry with the overpressure (in air) due to the blast overlayed on top. The overpressure function behaves roughly as inversely proportional to the square of the distance from the blast point. The minimum and maximum levels for the contours correspond to the smallest component fragility minimum and the largest component fragility maximum in the facility.
|
The viewer contains a single section view of the facility: front, top or side. The bounding box of the view is shown on the left hand side panel, as well as the value of the cut plane that the view is in. For top views, both the absolute height (elevation above sea level) and the relative height (above ground level) are shown. The user can set the extent of the view showing by changing the bounding box parameters, and then pushing the 'Redraw' button. The value of the cut plane can be set by moving the slider bar or typing in the value. Zooming is done with the mouse (press the mouse button at one corner of your desired zoom area, drag to the opposite corner, then release) or using the 'Scene' menu, the 'Camera' option, and then either 'Zoom In' or 'Zoom Out'. |

Figure 11. A Mark 82 blast simulation under the control room of a ficticious nuclear power plant. |
As the mouse is moved around the image, the status bar below the image shows the coordinates (usually feet), the name of the region, and the material code for the region. For detailed models, the names of critical components and their damage probabilities will also be displayed. For basic models, the building name will be displayed.
The 'File' menu allows the geometry to be exported or the current image to be saved.
The menu 'Scene', option 'Camera', option 'Default View' will set the bounding box and the cut plane to show the center of the blast and the extent of the blast for the selected view.
There are also several menu options under the 'Scene' menu which allow the user to change the view of the plant. These include which view (Top, Front, Side) and what type of render style to use (Filled or Edges).
The user can click on any point in the Blastwave Viewer to see a description of the QuickBlast calculation at that point: the distance from the blast point, the overpressure (in air) and a listing of what the blast would travel through (walls, air, components, etc) to get to that point.
The menu 'Help', option 'Blast Summary' will list the damaged components and their failure probabilities as well as any holes in walls caused by the blast.
A project consists of a facility and several incidents. Running projects is the real emphasis behind VISAC - to find out what will happen to a facility when subjected to various types of incidents.
A new project can be started by first loading the facility of interest and then selecting the menu option Project/Start a New Project.
An existing project can also be opened for editing, in which case the appropriate facility will also be loaded.
All of the projects are stored in the VISAC area, under the Projects Directory. This directory can be set using the VISAC menu System/Set VISAC Paths. Normally, this path will be something like Program Files\VISAC\Projects\. This path is left open to change so that advanced users could maintain different sets of projects. Care should be used here since any projects not in the current Projects Directory will not be able to be detected by VISAC, which may allow user defined projects to be edited even if they are used by a project.
All of the facility models can be reviewed by the user at this point. The logic models, the geometry model, the MBLM model and all of the different geomtetry viewers are available to the user.
The models can be accessed through the menu options or through the expandable tree structure on the left hand side of the VISAC window. Now that a project has been started, all of the facility and model information has been reduced to a single entry called "Facility", which can be expanded to reveal all of the model catergories usually visible when looking only at a facility without a project.
Incidents damage the basic events of the logic model, causing failures to propagate through the fault trees and event trees. The different incidents specify damage in different ways - either by directly assigning failure probabilities to basic events and top level fault trees or by specifying damage done to the geometry model, which is then linked back to the logic fault trees. With each incident, the user can specify a short incident name and the date/time of occurrence. Incidents are automatically sorted as they are entered, so that the user can enter them in any order. As incidents are added, edited, or deleted, the project is automatically saved.
 |
 |
 |
 |
 |
The mission planner can specify damage to the facility in five different ways:
QuickBlast - user picks a blast location using one of the geometry
display packages. The user can pick a point inside or outside a
building. The charge type and weight are also input by the user.
Three modes of calculating damage can be used. The user can try
different modes and different numbers of rays for his application
before saving the incident.
Three modes of calculating damage are:
| Ray Tracing Mode This works by sending out rays in uniformly in different directions. Along those rays, walls are broken and critical components are damaged. With more rays, the damage description gets more accurate but takes longer to compute. The pressure of the blast is evaluated on the surface of the component where the ray strikes it. |  | ||
| EVA-3D Mode This mode tries to emulate the EVA-3D methodology and uses the rays just to break walls. Critical components in rooms affected by the blast are then tested for damage by evaluating the pressure of the blast at the centroid of the component. This mode tends to break mode components since it can "see" around corners that the ray trace mode can not. |  | ||
| Direct Mode Similar to the ray tracing mode, except that rays are only thrown out in the horizontal plane and towards the centroid of each defined critical component. For facilities with small critical components, this mode may be faster than using the standard ray tracing technique. |  |
The 'QuickBlast' incident panel has five tabs:
Component Damage - The user selects any combination of individual
components from any of the facility buildings and assigns a failure
probability to each. The failure probabilities assigned to the basic
events will be treated as independent probabilities, with out any
assumed correlation. This option can also be referred to as the
"Sabotage" option, since no weapon is specified.
The 'Component Damage' incident panel has three tabs:
Region Damage - The user selects a region of one floor of one
building in which every component is killed. Either the geometry display
Edificio or the
2D Triple View Slicer
is used to allow graphical selection of the region.
Any component in that region is
returned to VISAC as a dead component. Only one region is allowed per
incident. For multiple regions or regions of odd shapes, multiple
incidents occurring at the same date/time can be used.
|
 |
| Edificio with a circular area on one floor | Triple View Slicer with a rectangular volume |
The 'Region Damage' incident panel has four tabs. The user can use either the 'Edificio' tab or the 'Triple View' tab - not both.
QuickBlast from Grids - For each facility, VISAC supplies over a thousand
QuickBlast calculations using a Mark 82, a Mark 84, and a truck bomb.
The user narrows down the list of choices by specifying which buildings to
consider, which weapons to consider and the following mission objectives:
The 'QuickBlast from Grids' incident panel has three tabs:
Accident - The user selects from a list of accidents defined for
the facility. These accidents are usually those which are modeled as
part of the plant's normal safety analysis report. Accidents assign
failure probabilities to top-level fault trees in the logic model.
The 'Accident' incident panel has three tabs:
A series of incidents can be defined so that cumulative damage can be analyzed. One of the assumptions in VISAC is that the time interval between incidents is short compared to the downtime of the damaged equipment. This way, anything damaged in incident 1 is assumed to still be damaged for incidents 2, 3 etc, no matter how much time is between incidents. If this is not the case for the mission being planned, e.g. the incidents are many months or years apart, then separate Projects should be used since considerable repairs could have been done in the interval between incidents.
The Incident menu has options that allow the user to add incidents, edit previously defined incidents and delete incidents. To edit an incident, simply click on any part of its description in the left panel of the main window, then select the menu "Incident/Edit Incident".
After each incident is defined or after all of them have been defined, the user can view the results. For each incident, there are several things the user can look at by first selecting an incident from the left panel of the main window, and then selecting an option under the Incident menu: (note - the results shown are cumulative, up to the selected incident)
For downtime results, there are three different downtimes listed: CDS algorithm, parallel and serial. The parallel and serial methods assume that all systems contributing to downtime have indepenent failure probabilities. The parallel repair schedule assumes that for a combination of systems, the repair time is that of the longest system repair time. The serial repair schedule assumes that the repair time for any given set of failed systems is the total repair times of those systems. The CDS algortihm finds the shortest downtime possible using the assumption that the failure probabilities are correlated and a parallel repair schedule is used. These downtimes should be considered rough estimates since repair/replacement times can change due to specific circumstances.
The above results can viewed on screen and also printed to the local printer. These reports (except the graph) all exist in the project area, under the subdirectory of the project name, as ASCII text files that can be imported into word processors.
For any incident, the cumlative damage can be shown graphically using the Triple View Slicer, the QuickView 3D or the 3D Ray Tracer viewer.
For all of the incidents together, timelines can be made to show how probabilities of different outcomes change with each incident. Two versions are available: a graph where the total of the bad conquences for each aspect is shown or a graph where every consequence of a single aspect is shown. These graphs can be viewed by using the Post-Project/View Timeline menu. JPEG images of the graphs can be saved to disk for use in reports.
MBLM 54d, developed by SAIC, can be used to calculate the amount of materials released to the atmosphere. Once the incidents have all been added to the project, the information about damaged compents and incident types can be combined with the MLBM inventory files to create an input deck for an MBLM calculation. MblmGui can be used to fill in any missing details in the MBLM model and run MBLM 54d. This is done in two steps:
Full implementation of MBLM in VISAC is currently on hold, pending other issues with HPAC integration.
Releases used by VISAC for nuclear power plant core damage were calculated using MELCOR for six different combinations of core damage:
In the future, the capability to run MELCOR after a project may be added to VISAC. This would allow VISAC to model more precisely what was released, instead of restricting it to one of six pre-calculated outcomes. VISAC would calculate which components of the core were damaged to a significant level, and then create a MELCOR input deck by relating the VISAC damage to MELCOR modeled flow paths.
MELCOR - a computer code for analyzing severe accidents in nuclear power plants and other facilities, was developed at Sandia National Laboratories for the US Nuclear Regulatory Commision.
VISAC allows the user to create new facilities based off of one of the existing library facilities or another user-created facility. Due to the complexity of facility models, starting from scratch is probably not likely for most users.
To create a new facility, simply select the menu option Facility/Start a New Facility. VISAC will ask which existing facility to use and what the name of the new facility will be. VISAC then copies the models from that base facility over into a new directory (under UserFac\) with the new name. The user is then free to edit the new facility as much or little as he wants. The facility will remain open to editing as long as no projects exist that use that facility.
All of the user defined facilities are stored in the VISAC area, under the User Facility Directory. This directory can be set using the VISAC menu System/Set VISAC Paths. Normally, this path will be something like Program Files\VISAC\UserFac\. This path is left open to change so that advanced users could maintain different sets of user defined facilities.
Editing the geometry of a facility is mostly handled with the Edificio package. Edificio allows the user to move buildings relative to one another and to move components within those buildings. Buildings from different facilities can be combined into new facilities. Multiple copies of buildings or components inside buildings can be made. Components of detailed plants should correspond to a basic event in the logic model. When adding to the model, components should be added to the geometry first, then to the logic model. To save your changes, be sure to select File/Save from the Edificio menu before quitting the geometry editor.
These changes can be made using the Facility/Edit Geometry Model menu options:
It will be useful to use the VISAC geometry display packages (Triple View Slicer, QuickView 3D, and 3D Ray Tracer) as a check while you edit the geometry of the new facility.
The logic models tell VISAC how to propogate damage from the basic events, through the plant safety systems to a final consequence for each aspect of the plant.
Individual basic events (which correspond to the geometric critical components) are connected using "and" and "or" gates to form fault trees for plant subsystems. These fault trees are then connected together using an event tree. Paths through an event tree, sequences, are determined by which fault trees have been failed due to basic event damage. Each sequence in an event tree ends with with either another event tree or a consequence. Several event trees are then grouped together to form an aspect of facility operation.
The logic models are all editable by using the choices under the Models/Edit Logic Model menu option:
For damage information to move from the geometry model to the logic model, a link between geometry critcal components and logical basic events must be made. This link is editable by the user. Any number of critical components can be mapped to a basic event. Any given critical component can be mapped to exactly one basic event.
These mappings from geometric critical component to logical basic event can be made using the Facility/Edit Geometry Model/Link to Logic Model menu option or by selecting the Geomtry Model, Link to Logic Model tab in the expandable tree structure.
Once the geometry and logic models have been finalized, grids of Quick Blast calculations can be made. A grid is simply a set of blast points filling a 3D rectangle. At each point a Quick Blast calculation is done and the results for all points are stored together. These points can then be searched by outcome. Users can define the extent of the grid rectangle in all three dimensions, the spacing of the grid points, the size and type of explosive and the method of ray tracing for the Quick Blast calculation.
For a given facility, grids can be created automatically by VISAC. This is done using the menu option Facility/Grids/Setup Standard Grids. (Note: this will erase any existing grids for the facility.) This option does not calculate the blast damage at each grid point, it only determines the grid parameters. Standard grids made by VISAC include:
The user does have to have VISAC create the standard grids. The user may define his own grids (or none at all). To define your own grids, launch the Contour viewer using the VISAC menu option Facility/Grids/Edit Grid Parameters. In the Grid Select box, the user can click on the "add" button to start defining a new grid. The points can be calculated with each grid definition or calculation can be put off until all the grids are defined.
To define your own grids or edit existing grids, launch the Contour viewer using the VISAC menu option Facility/Grids/Edit Grid Parameters. In the Grid Select box, the user can select one of the grids listed and then click the "edit" to change the parameters of that grid. The user can also click on the "add" button to start defining a new grid.
Grid parameters have four main parts:
The blast points can be calculated with each grid definition or calculation can be put off until all the grids are defined.
After all the grids have had their parameters defined, VISAC can be told to calculate them all using the menu option Facility/Grids/Recalculate Grids. Depending on how complex the geometry and logic models are, this calculation could take some time (hours).
When a new facility is created based on one of the VISAC library facilites, the grid parameters are copied to the new facility but the results are not. It is assumed that the new facility was created because significant changes to either the logic or geometry models were going to be made, thus invalidating the quick blast results from the original library facility. The user can keep these grid definitions, delete them, or write over them when generating the standard grids.
For plants where chemical releases are important, an MBLM model can be added to the logic and geometry models. MLBM is the multi-chamber blowdown model code developed by SAIC.
Since VISAC will add gas generators based on the incidents used in projects, only the basic room-connectivity of the MBLM model needs to be supplied when creating a new facility. This is done using MblmGui.
The plant inventory is a list materials that each basic event contains, and which room it is located. This is used to link the MBLM model to the logic model. When incidents break basic events, the corresponding materials are released during the MBLM calculation.
 VISAC under HPAC (NFAC)
HPAC, Hazard Prediction and Assessment Capability, developed by Oak Ridge National Laboratory, is a material transport code that can use VISAC to generate source terms for nuclear facility incidents (NFAC module). More info on HPAC can be found here.
 Installation of VISAC
When VISAC is installed onto a system that already has HPAC 4.03 or higher, VISAC can be used to calculate nuclear power plant releases for an NFAC (Nuclear Facility) incident. Early versions of HPAC cannot make use of VISAC directly. HPAC must be installed before VISAC is installed.
 VISAC/NFAC Mappings
In order for NFAC and VISAC to "talk" to each other, a mapping must be made from the NFAC facilities of interest to the VISAC facilities. This can be done using VISAC and selecting the menu 'System', option 'Edit NFAC Associations'.
A window will be launched that shows all of the current mappings. If the NFAC facility you are interested in does not appear on the list, you can create a new mapping. Simply select an NFAC plant (by choosing the country, then the reactor) and a VISAC facility model then select the "Make Association" button. Not every nuclear power plant in the world is modeled by VISAC, so you may have to pick a VISAC facility that is similar in design. A dialog box will then ask whether or not this is an exact match and allow you to enter in a short comment about how well the VISAC facility models the NFAC plant The match can be specified as either "exact" or just "close".
WARNING: Since VISAC has the capability of calculating the effects of blast damage, mapping a real facility in NFAC to a VISAC facility will make VISAC a classified program. If you intend to run VISAC under HPAC for real facilities (as opposed to generic, non-existent plants), you should only do this on computer systems that have been certified to hold "CLASSIFIED - NATIONAL SECURITY INFORMATION" data.
If the VISAC library does not contain an appropriate plant for the NFAC facility you wish to run HPAC/VISAC for, a new VISAC facility can be created. Simply start VISAC and use it as described in Create/Edit Facilities. The facility will be stored in the UserFac directory of VISAC. This new facility can then be mapped to the NFAC plant just as any other VISAC facility from the VISAC library could have been.
The NFAC module of HPAC may also have a shortcut button to launch VISAC in New Facility Mode, which will allow the user to create the new plant and make the NFAC mapping, but will not allow projects to be run. Most likely, this will not happen so if the user wishes to create or edit VISAC facilities, he will have to do so by running VISAC by itself.
 Running an NFAC Incident
Inside an NFAC incident, first you will choose a reactor. There will be a note as to whether or not a VISAC facility has been mapped to this NFAC plant. If there is a valid VISAC model, under the 'What' tab, select 'Technical Analysis' for the incident type, then select the 'Define Incident' button. In the 'Select Source Term' dialog box will appear with the following choices for the source term:
Select 'VISAC' from the list and then select 'Next'. VISAC will be launched in single-project mode. The user will only be allowed to add/edit/delete incidents for the project that is automatically started. The user will not be able to edit facilities models. When the user is done defining all of the VISAC incidents and is ready to calculate the final release, select the VISAC menu 'System' and the option 'COMMIT'.
Choose ReleaseAfter finishing the VISAC project and committing it, a new window will be displayed asking the user to select which release to send back to NFAC. VISAC is a probabilistic code - it calculates what the probabilities are for a variety of outcomes. NFAC is a deterministic code - it calculates what happens for one given release. So, NFAC can only run one release. The user must pick either one of the possible VISAC releases or pick a probability-weighted combination of all possible releases.
The final probabilities of all of your VISAC incidents will be shown, for each aspect that has a consequence that leads to a release (and has a release file).
If there are multiple aspects in the VISAC models, the user must choose which release to use for each aspect. The final release will then be the sum of the releases for each aspect. This may appear odd in NFAC, since some release percentages will add up to greater than 100%.
The "Choose Release" window has the following steps:
The release information will then be transferred back to NFAC.
Oak Ridge National Laboratory, 2004
 . The
cursor will change to a bomb. Click and drag the cursor to
create a circular area. To commit the area, select the 'big
red button' icon
. The
cursor will change to a bomb. Click and drag the cursor to
create a circular area. To commit the area, select the 'big
red button' icon
 . The region will
then be sent back to the VISAC incident.
. The region will
then be sent back to the VISAC incident.
 .
The cursor will change to a set of crosshairs. At the desired location, click
to select the blast point.
.
The cursor will change to a set of crosshairs. At the desired location, click
to select the blast point.