


Facility Vulnerability with VISAC |
|
|
|
|
|
 3D Ray Tracer
This program generates a 3D view of the plant geometry by ray tracing. Ray tracing can be slow for complex geometries but produces excellent images at full resolution. This geometry viewer can also used to set individual component failure probabilities for VISAC Component Damage incidents.
The 3D ray tracer allows the user to degrade the resolution to generate faster images. This is done using the radiobuttons above the image. The numbers represent the number of pixels that will be grouped together per ray. For example, resolution 4 uses a 4 by 4 group of screen pixels for one ray. Resolution 1 uses a single pixel, and therefore takes 16 times as long to create a full image as does resolution 4.
|
The user can move the camera around the facility by selecting options from the 'Scene' menu, 'Camera' option. Options include camera position (moves camera up, down, right, left, forward or backward), camera orientation (twists camera up, down, right or left), and camera revolution, which rotates the camera around the model (up, down, right or left). Zooms are made by moving the camera position forward or backward. Zooms can also be done by selecting a rectanglular region (press the mouse button at one corner of your desired zoom area, then drag to the opposite corner, then release). The default view can be restored using the 'Scene' menu, 'Camera' option, 'Default View' option. When using the 3D Ray Tracer to make presentation-quality images, users are encouraged to use QuickView 3D to quickly find a good camera angle, and then launch the 3D Ray Tracer package from that program. Navigating the camera around the Ray Tracer can be very time consuming. |
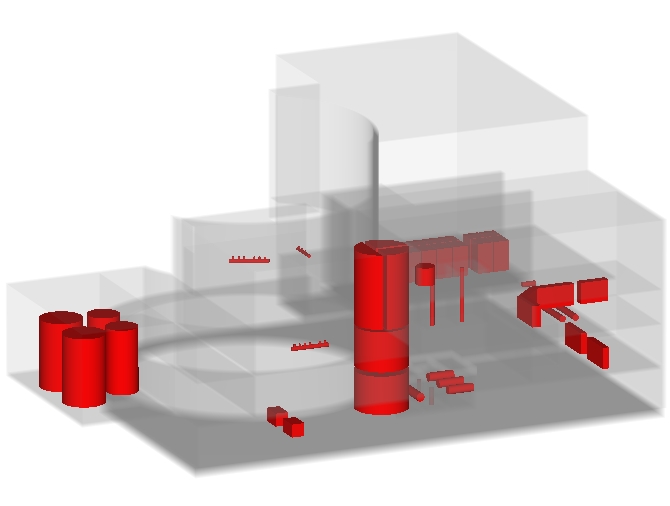 Figure 8. The auxiliary building of the west560 plant. Concrete is shown with an alpha of 13. |
As the mouse is moved around the image, the status bar below the image shows the coordinates (usually feet), the name of the region, and the material code for the region. For detailed models, the names of critical components and their damage probabilities will also be displayed. For basic models, the building name will be displayed.
The geometries for the VISAC library plants have collections of related regions called groups. These groups can be selected or de-selected for display by using the 'Geometry' menu, 'Choose Groups' option.
Colors for each material type present can also be selected by the user by using the 'Geometry' menu, 'Materials/Colors' option. Another way to help visualize the interior of facilities is to make some of the materials transparent. Associated with each material is an alpha value. An alpha of 255 makes a material completely opaque and an alpha of 0 makes a material completely transparent. An alpha between 0 and 255 will make a material partially transparent. For example, with alpha=25, a material will be transparent up to 10 feet (25/255=10). After 10 feet, that material will appear opaque.
The 'File' menu allows the geometry to be exported or the current image to be saved.
To better visualize the internal components, users can set cutter planes to remove sections of the geometry. This is done using 'Scene' menu, 'Cutter Box' option. For each dimension, a cut plane can be defined and the user can select to keep below that plane or above that plane. The user can also specify if he wants to show the geometry for the intersection of the cut planes or the union of the cut planes. Changes will take effect after the 'Redraw' button is pressed.
Render time for an image and the estimated full resolution render time can be found using the 'Help' menu, 'Render Times' option.
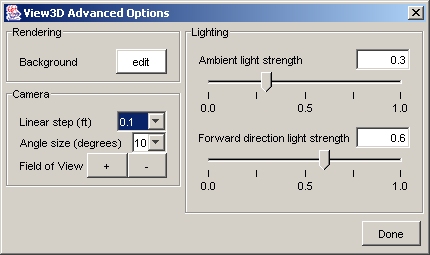
Advanced OptionsThe 'Scene' menu, 'Advanced Options' option allows the users to control some of the finer points of the 3D rendering. These include the background color (default is white), the step sizes to take when performing a camera position or orientation change, and the strengths of the ambient and directional lighting, which can be set to enhance the 3D look of the image. Changes will take effect after the 'Redraw' button is pressed. |
|
When using the 3D Ray Tracer to make presentation-quality images, users are encouraged to use QuickView 3D to quickly find a camera angle, and then launch the 3D Ray Tracer package from that program. Navigating the camera around the Ray Tracer can be very time consuming.
When used to set critical component failure probabilities for a Component Damage incident, simply double click on a critical component to bring up a window to set that component's failure probability. Damaged components will appear in a different color after the next 'Redraw'. There are two tricks to help pick components out of buildings:
Oak Ridge National Laboratory, 2004