


Facility Vulnerability with VISAC |
|
|
|
|
|
 Topographic Viewer
This viewer shows the terrain elevations near the facility in the style of a topographic map. For some of the library facilities, elevation data is supplied at a few points near the main buildings. Elevations at other places are calculated by forming triangles between the known points and interpolating.
|
The user can move the camera around the facility by selecting options from the 'Scene' menu, 'Camera' option. The default view can be restored using the 'Scene' menu, 'Camera' option, 'Default View' option. The user can set the extent of the view showing by changing the bounding box parameters, and then pushing the 'Redraw' button. Zooming is done with the mouse (press the mouse button at one corner of your desired zoom area, drag to the opposite corner, then release) or using the 'Scene' menu, the 'Camera' option, and then either 'Zoom In' or 'Zoom Out'. On the right hand side, a scale bar is shown with the minimum and maximum elevations of the facility. Also on the scale bar are the major and minor contour lines and their elevations. |
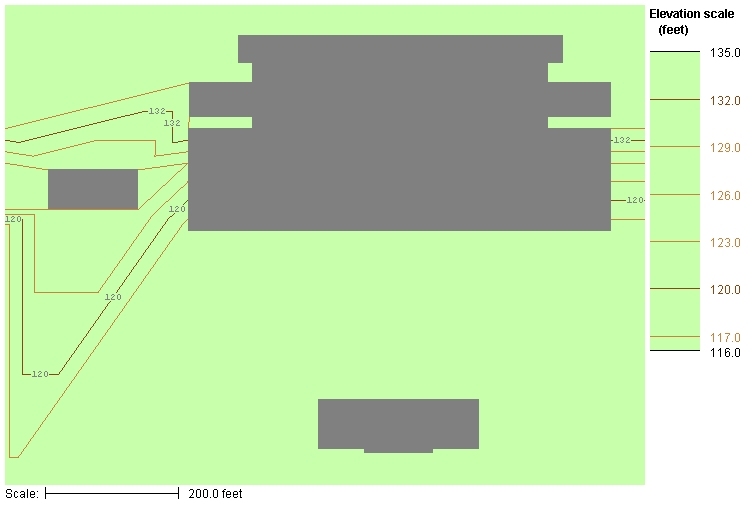 Figure 9. Topographic data shown around a facility. |
As the mouse is moved around the image, the status bar below the image shows the coordinates in feet, with the z dimension being elevation above sea level. If the mouse is pointing at a building, the building name will also be shown in the status bar.
The 'File' menu allows the geometry to be exported or the current image to be saved.
Many different items can be added to the image, in any combination. Each can be turned on or off. Once all of the layers you desire are selected, use the 'Redraw' button to update the image.
Changes will take effect after the 'Redraw' button is pressed.
Since different facilities will have different scales of elevations, the user is allowed to change the intervals for the major and minor contour lines. These can be set using the 'Scene' menu, then 'Advanced Options'. Enter the values for how often you wish contour lines to appear.
Labels are placed randomly on the major contour lines. The number of labels is controlled by the label frequency, a value between 0 and 1. A value of zero will not generate any labels. A value of 1 will place a label for each contour in each interpolating triangle. To change the label frequency, use the 'Scene' menu, then 'Advanced Options'.
Oak Ridge National Laboratory, 2004