


EFTed - Event/Fault Tree Editor and Display |
|
|
|
|
|
The basic layout of EFTed is a set of tabbed panes showing each of the event trees in the given problem. Each event tree can be viewed by clicking on the tab for that event tree.
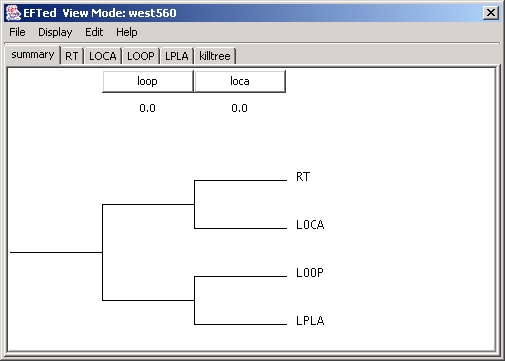
Event trees consist of a set of sequences, defined as the failure or non-failure of specific fault tree gates. At the end of each sequence is either a consequence name or the name of another event tree. In the example above, the first of five event trees is shown. It has four consequences defined by the failure or non-failure of two fault tree gates: "loop" and "loca". Each sequence leads to another event tree, which can then be viewed by clicking on its tab. This is referred to as a master event tree that points to four different slave event trees.
The top of any event tree consists of a banner listing the top-level gates of the fault trees. Associated with each of these major systems is a simple failure probability. The simple failure probability is the probability that the system will fail when the initiating event occurs, independent of any damage inflicted on the components of the plant.
To view the fault tree associated with a top-level gate listed in the event tree banner, simply left click on its name. A more detailed description of a top-level gate can be found by positioning the mouse cursor over the name. For example, placing the cursor on the "loop" button, a pop-up window will display "Off Site Power". Clicking on "loop" gives us the fault tree for the "loop" gate, shown below.
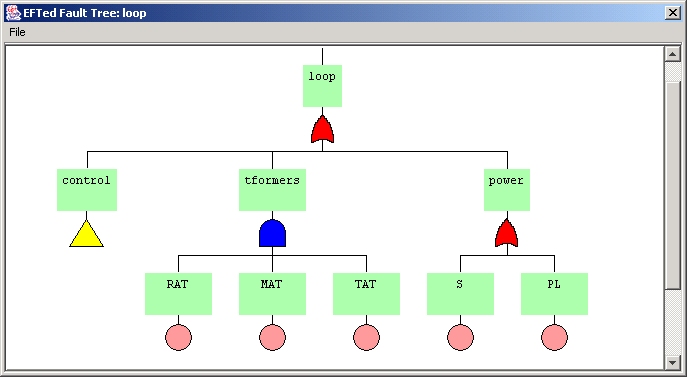
Note that the typical symbols used in probabilistic safety analysis are used to display the fault trees. Gates are shown as either an AND gate (blue symbol above), an OR gate (red symbol) or a TRANSFER gate (yellow triangle). Individual components of the plant are shown as basic events (pink circles). Gates can consist of any number of other gates and basic events. TRANSFER gates can be shown by left clicking on the either the triangle or the name box above the triangle.
In any of the three modes, more detailed information about a gate or basic event can be obtained by right clicking on the symbol or name box.
Oak Ridge National Laboratory, 2004